
Fig. 1 Schematic of the deep ocean circulation (Stommel, 1958; Deep-Sea Res., 5, 80-82). The dots at the north and south ends of the Atlantic Ocean show the sinking places of cold water, namely the formation regions of deep water.
The Division of Physical Oceanography, ORI stresses on a study
of the deep ocean circulation in the Pacific Ocean. The ocean
circulation in a deep layer below about 2000-m depth is
generated by sinking of a cold dense water cooled at high
latitude. This is completely different from the circulation in
a surface layer generated by wind changes. Significant sinking
of seawater occurs off the Greenland and in the Weddel Sea
located at the north and south ends of the Atlantic Ocean,
respectively. The deep waters generated there flow into the
Antarctic Circumpolar Current and are carried eastward around
the Antarctica, and reach into the Indian Ocean and the Pacific
Ocean (Fig. 1).
Such knowledge has been obtained more than 40 years before. However, the effect of bottom topography is not considered, and part of the circulation in Fig. 1, in particular the current in the North Pacific, is not correct. Observational studies conclude that the deep water flows finally into the Northeast Pacific Basin and finishes the long travel by upwelling to the shallower layer. The Northeast Pacific Basin is the terminal of the deep ocean circulation.
Fig. 1 Schematic of the deep ocean circulation (Stommel, 1958;
Deep-Sea Res., 5, 80-82). The dots at the north and south ends
of the Atlantic Ocean show the sinking places of cold water,
namely the formation regions of deep water.
Although such an image of the deep current is concluded, details
are not exactly known in terms of where and how much the deep
current flows. Characteristics of deep water have become faint
before it reaches the North Pacific, due to a mixing with the
surrounding water. In order to find a remnant of the
characteristics of high salinity and high dissolved oxygen,
quite high accuracy for the measurement by CTD (Conductivity -
Temperature - Depth profiler) and the chemical analysis of water
samples are required. Study of the deep current based on
observations of water properties is not easy.
Complicated bottom topography also makes difficult the current
study. The deep current goes northward along the western coast
of the South Pacific and passes the Samoan Passage at 10°S.
The problem is the current after that, namely where the deep
current flows after passing the Samoan Passage. This is the
first subject about the Pacific deep current at present.

CTD observation
To solve this subject, we made CTD observations at Lines A-D in Fig. 2 in the Hakuho-Maru KH-99-1 cruise from January 14 to March 4, 1999.

Fig. 2. Stations of the CTD casts made by the Division of
Physical Oceanography, ORI during 1991-99 (red dots) and lines
of CTD carried out in the World Ocean Circulation Experiment
(WOCE) (blue lines). Our CTD observation at 165°E was also
made as part of the WOCE.
Figures 3-5 show vertical distributions of potential temperature, salinity, and dissolved oxygen at Line A. The coldest water exists near the sea bottom at the right edge of Fig. 3 (14°N-18°N) which is the place linking to the Wake Island Passage. Salinity and dissolved oxygen of this water are highest in layers except a surface layer (Figs. 4 and 5). Thus, this water keeps deep-water characteristics and is thought to be carried by the deep ocean circulation.
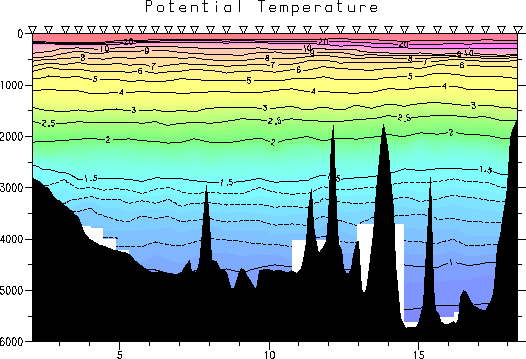
Fig. 3 Vertical distribution of potential temperature (°C)
at Line A observed in the Hakuho-Maru KH-99-1 cruise.
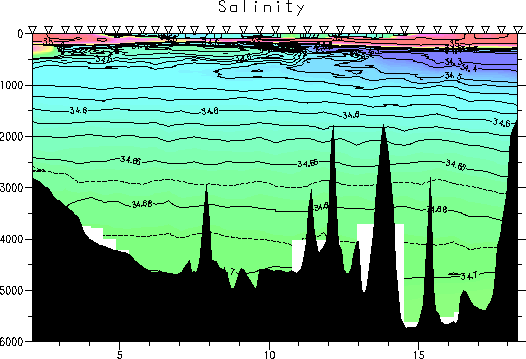
Fig. 4 Same as Fig. 3 but for salinity.

Fig. 5 Same as Fig. 3 but for dissolved oxygen (ml/l).
Plotting salinity near the sea bottom with all the CTD data we took since 1991 (Fig. 6), distribution of saline water and bottom topography show that the near-bottom current at about 5000-m depth flows like the blue arrows.
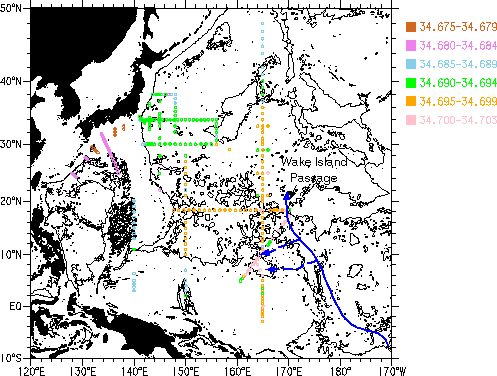
Fig. 6 Horizontal distribution of near-bottom salinity obtained
from the CTD casts down to deeper than 4000 m at red dots in
Fig. 2. Thin lines are 5000-m isobaths. Blue arrows indicate
the deep currents at about 5000-m depth inferred from salinity
distribution and bottom topography.
Horizontal distributions of dissolved oxygen on isopycnal surfaces at depths of about 4000 m and 3000 m are shown in Figs. 7 and 8, respectively. In these layers, the Melanesian Basin is open to the deep current. This is a great difference from the 5000-m depth. On the isopycnal around 4000-m depth, high-oxygen water exists in the Melanesian Basin and the East Mariana Basin (located northwest of the Melanesian Basin). This shows that the deep current flows in these basins like the blue arrows in Fig. 7. On the isopycnal around 3000-m depth, high-oxygen water further extends to the East and West Caroline Basins (located west of the Melanesian Basin). The deep current flows in these basins and the East Mariana Basin after passing the Melanesian Basin, and then enters the Philippine Sea, as shown by the blue arrows in Fig. 8.

Fig. 7 Horizontal distribution of dissolved oxygen (ml/l) on
the isopycnal surface (σ4 = 45.870) at about
4000-m depth. Thin lines are 4000-m isobaths. Blue arrows show
the deep currents at about 4000-m depth inferred from oxygen
distribution and bottom topography.
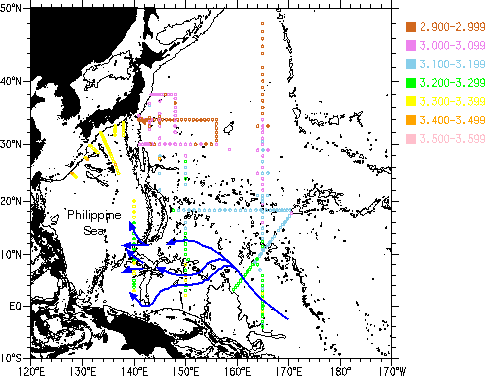
Fig. 8 Horizontal distribution of dissolved oxygen (ml/l) on
the isopycnal surface (σ4 = 45.820) at about
3000-m depth. Thin lines are 3000-m isobaths. Blue arrows show
the deep currents at about 3000-m depth inferred from oxygen
distribution and bottom topography.
At high latitudes in the North Pacific, direct measurement of current velocity with moored current meters is more important, because the water characteristics become more obscure in a further downstream region.
 |
 |
| Schematic of a mooring system (left) and mooring work on R/V Hakuho Maru (right). | |
Velocity of deep current at about 4000-m depth has been observed with moored current meters at the points in Fig. 9, and the mean velocity is obtained as in Fig. 10.

Fig. 9 Mooring stations for current measurement at depths more
than 4000 m by the Division of Physical Oceanography, ORI (red
circles) and by American and German scientists (blue circles).
Orange circles show the moorings under observation by the
Division of Physical Oceanography, ORI.
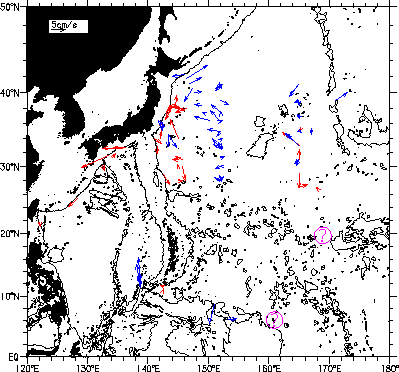
Fig. 10 Mean velocity at the stations in Fig. 9. The velocity
at the orange circles in Fig. 9 is unknown until the moorings
will be recovered in February 2000, and the symbol ? is marked
there.
Figures 10 and 11 show that a southward current exists over the western slope of the trenches running meridionally east of the Japanese Islands (Japan Trench, Izu-Ogasawara Trench, Mariana Trench), while a northward current exists over the eastern slope. We think that these currents form an anti-clockwise circulation in the trenches. The current of the deep ocean circulation coming from the South Pacific seems to be the westward and northwestward currents to the east of the Japan Trench.
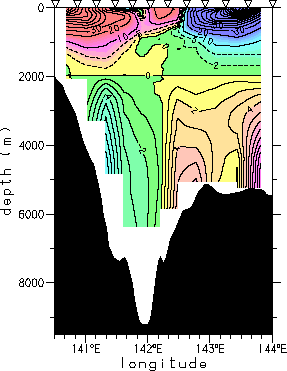
Fig. 11 Geostrophic velocity referred to 2000 m (cm/s) in the
zonal section at 34°N over the Izu-Ogasawara Trench.
Positive means northward. The current is southward over the
western slope (Japanese Islands side) of the trench and
northward over the eastern slope.
To clarify the variations of deep current velocity, we deployed
five moorings on the western slope of the Melanesian Basin and
two moorings in the Wake Island Passage in the Hakuho-Maru
KH-99-1 cruise (orange circles in Fig. 9). Four or five current
meters are set on a mooring, and totally thirty-one current
meters are measuring velocity at depths more than 2000 m. These
moorings will be recovered by R/V Mirai of the JAMSTEC in
February 2000. We will give the solution of mean velocity at
the place put ? in Fig. 10, and will examine a variability of
the deep current.
We hope to clarify the deep ocean circulation in the whole region of the North Pacific by a synthetic analysis of current velocity data and high quality CTD data (temperature, salinity, oxygen, nutrients, etc.) taken in the WOCE and our cruises.